Distributed tracing in MLflow

We're excited to announce that MLflow 3.9.0 brings distributed tracing, which supports connecting spans from multiple services into a single trace.
What's Distributed Tracing?
When your application spans multiple services, you may want to connect spans from these services into a single trace for tracking the end-to-end execution in one place. MLflow supports this via Distributed Tracing, by propagating the active trace context over HTTP so that spans recorded in different services can be connected into a single trace.
Typical use cases:
- Multi-agent orchestration: Track how multiple specialized agents (planner, researcher, coder) collaborate and identify which agent caused a failure or bottleneck.
- Remote tool calling chain observation: Track spans generated by nested remote tool callings, and identify which remote tool caused a failure or bottleneck.
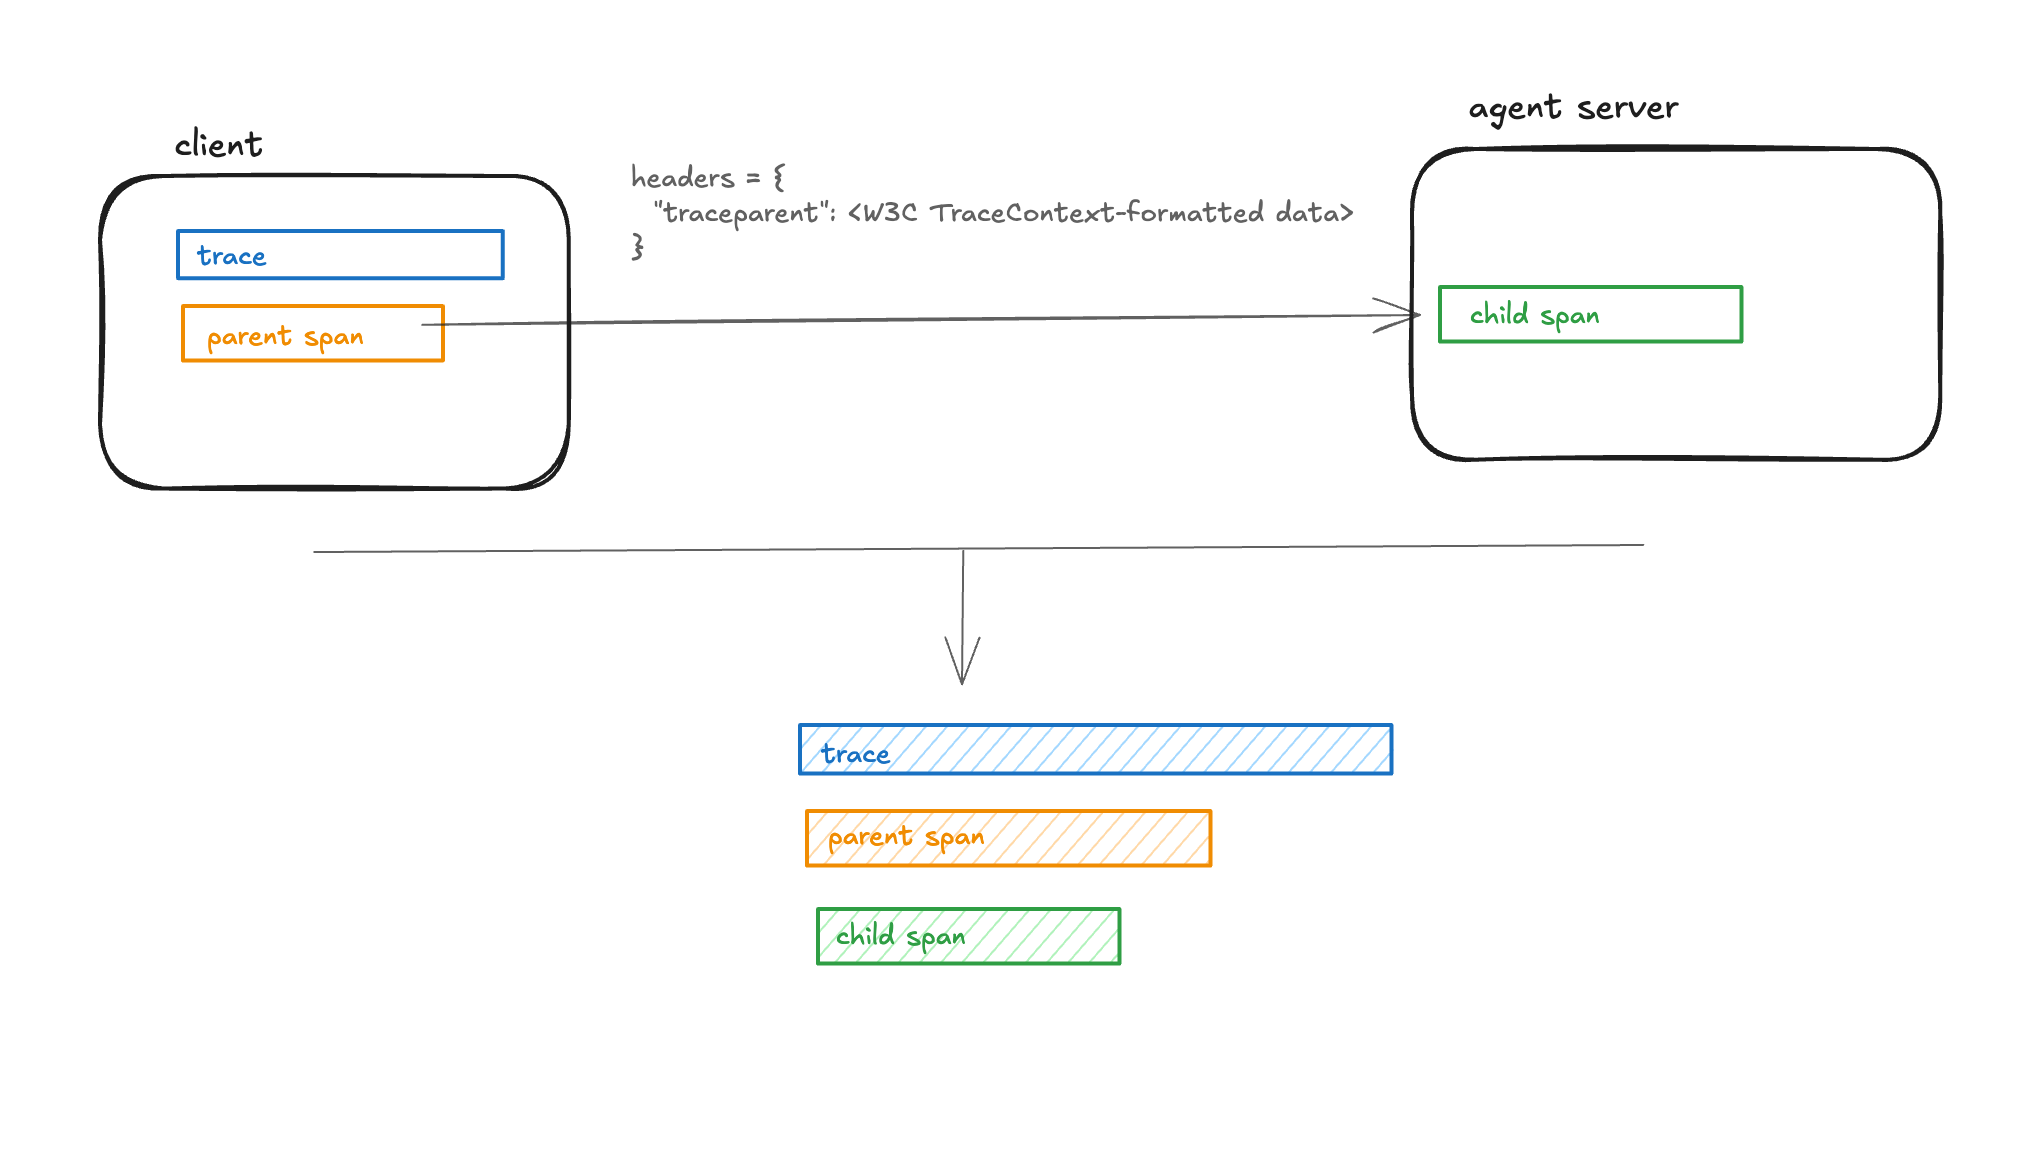
Using MLflow distributed tracing
The following is a simple example of distributed tracing with an LLM application made up of two services: a client and a server. The client creates the trace and the parent span, while the server adds a nested span. To achieve this, the trace context (including the trace ID and the parent span ID) is formatted according to the W3C TraceContext specification and passed in the request headers from the client to the server. MLflow provides two APIs to simplify fetching headers in the client and ingesting them in the server:
- Use the mlflow.tracing.get_tracing_context_headers_for_http_request API in the client to fetch headers.
- Use the mlflow.tracing.set_tracing_context_from_http_request_headers in the server to extract the trace and span information from the request headers and set them to current trace context.
Client example
import requests
import mlflow
from mlflow.tracing import get_tracing_context_headers_for_http_request

with mlflow.start_span("client-root"):
    headers = get_tracing_context_headers_for_http_request()
    requests.post(
        "https://your.service/handle", headers=headers, json={"input": "hello"}
    )
Server handler example
import mlflow
from flask import Flask, request
from mlflow.tracing import set_tracing_context_from_http_request_headers

app = Flask(__name__)


@app.post("/handle")
def handle():
    headers = dict(request.headers)
    with set_tracing_context_from_http_request_headers(headers):
        with mlflow.start_span("server-handler") as span:
            # ... your logic ...
            span.set_attribute("status", "ok")
    return {"ok": True}
Databricks configuration
If you set up MLflow tracking to Databricks, to make distributed tracing work, the trace destination must be set to Unity Catalog. Please refer to Store MLflow traces in Unity Catalog for details.
Learn More
Ready to get started with distributed tracing in MLflow? Check out these resources:
Join the Community
We're excited about the possibilities this integration opens up and would love to hear your feedback and contributions.
For those interested in sharing knowledge, we invite you to collaborate on the MLflow website. Whether it's writing tutorials, sharing use cases, or providing feedback, every contribution enriches the MLflow community.